The September CPI numbers, with their time periods
The Bureau of Labor Statistics reports a 3.7% annual increase in the all-items CPI-U and a 2.6% annual increase excluding food and energy. The monthly headline change is seasonally adjusted; the annual figures are not. Keeping those labels attached prevents an easy mistake: comparing a one-month rate with a twelve-month rate as if they measured the same thing.
| Measure | September 2026 result | Basis |
|---|---|---|
| Headline CPI-U, monthly | +0.6% | Seasonally adjusted |
| Headline CPI-U, annual | +3.7% | Not seasonally adjusted |
| CPI excluding food and energy, annual | +2.6% | Not seasonally adjusted |
Why your household may experience a different increase
A national index combines many categories. Your own mix of rent, transport, food and services may look different. Our practical approach is to compare like-for-like expenses over time: the same subscription, a similar grocery basket and comparable travel needs. Separate a higher price from buying more of something. A personal budget change can reflect both, and combining them makes it difficult to identify an adjustment you can actually make.
A small purchasing-power example
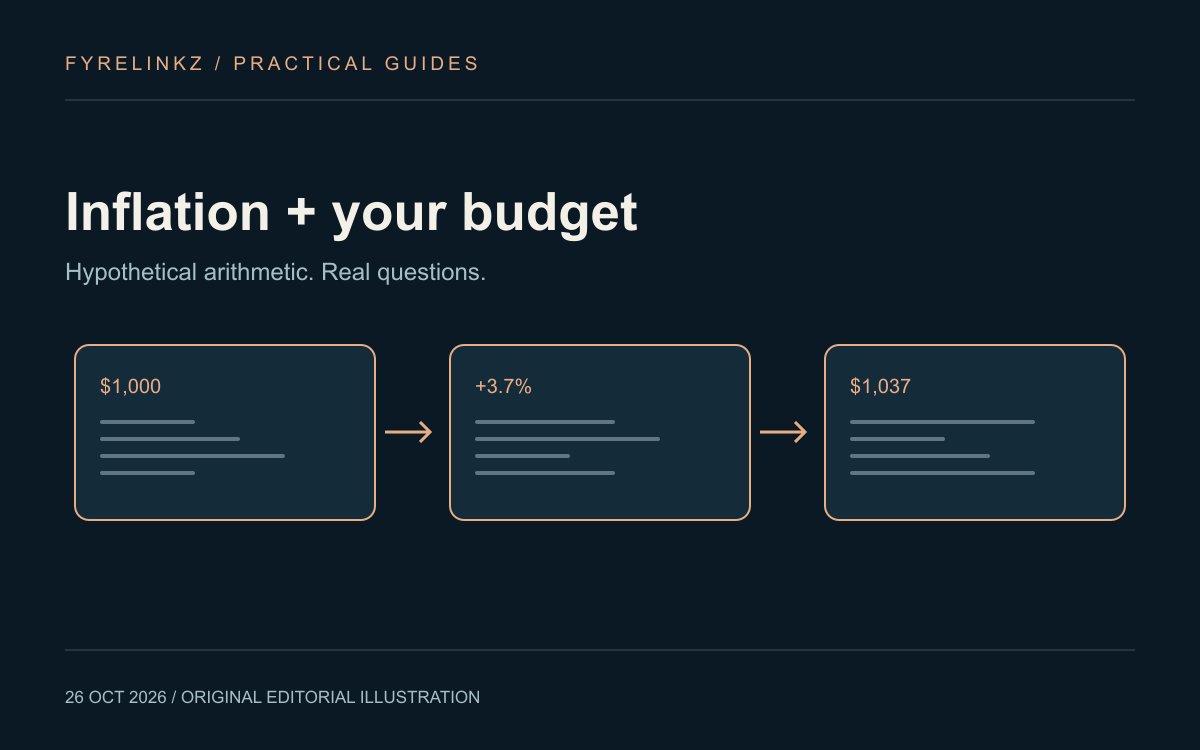
This is hypothetical arithmetic, not a forecast. If a basket costs $1,000 and its price rises exactly 3.7%, it would cost $1,037 after that increase. Applying the national CPI rate to your entire budget assumes your spending basket behaves like the index, which may be wrong. Use the example to understand percentages; use your own bills to estimate the cash you need. We are not recommending an investment or a particular response to inflation.
Separate a price increase from buying more
Use our household price worksheet to record the same item, unit size and quantity in both periods. In a hypothetical example, ten identical items at $4 cost $40. If the unit price becomes $4.20 while quantity stays ten, spending becomes $42: a $2 price effect. Buying twelve at $4.20 costs $50.40, but that $10.40 spending increase includes additional quantity. Reporting all of it as inflation would misdescribe the example. This worksheet is for household recordkeeping, not an estimate of the official CPI.
| Hypothetical basket | Unit price | Quantity | Total |
|---|---|---|---|
| Baseline | $4.00 | 10 | $40.00 |
| Same quantity, new price | $4.20 | 10 | $42.00 |
| New price and larger purchase | $4.20 | 12 | $50.40 |
What this release does not tell you
One inflation release does not establish the next interest-rate decision, tomorrow's currency move or which investment will outperform. Keep reported data separate from market expectations and forecasts. For immediate planning, check the renewal terms of important bills and distinguish fixed commitments from flexible spending. Our emergency savings guide offers a worksheet for unexpected costs; our investment fee guide explains a different source of purchasing-power drag.
- Label every statistic with geography, date and measurement period.
- Compare similar purchases rather than different quantities.
- Use current bills to update a budget.
- Check an official central-bank statement before describing a policy decision.
Which savings question comes next?
This article describes US price data for September 2026, not Indian inflation or a forecast of the next release. US readers comparing cash products can use the savings versus CD guide. The separate India savings, FDs and metals guide uses an Indian deposit-protection context. Keep geography, tax assumptions and account terms separate when applying either example.
Frequently asked questions
Was September 2026 US inflation 3.7%?
Yes. BLS reports a 3.7% twelve-month increase in all-items CPI-U. The monthly seasonally adjusted increase was 0.6%.
Does 3.7% mean every household's costs rose by that amount?
No. A household's purchases and quantities can differ from the national index basket.
Does this report confirm a Federal Reserve rate change?
No. Inflation data and a monetary-policy decision are separate events. Verify an actual decision through an official statement.
How can I check my own price changes?
Compare the same item, unit size and quantity in two periods, separating price changes from quantity changes. The downloadable worksheet is personal recordkeeping, not an official CPI estimate.
Sources & further reading
Primary sources checked Oct 26, 2026. Vendor statements are attributed; editorial advice is our own.
- 1Consumer Price Index — September 2026 ↗US Bureau of Labor Statistics · Oct 14, 2026
Help us keep this useful. Report a factual correction →